EPOXI
Two intriguing investigations -- One flight-proven spacecraft
Gallery
Lunar Hydration: Figures from Science Paper
Fig 1
 300 dpi jpg
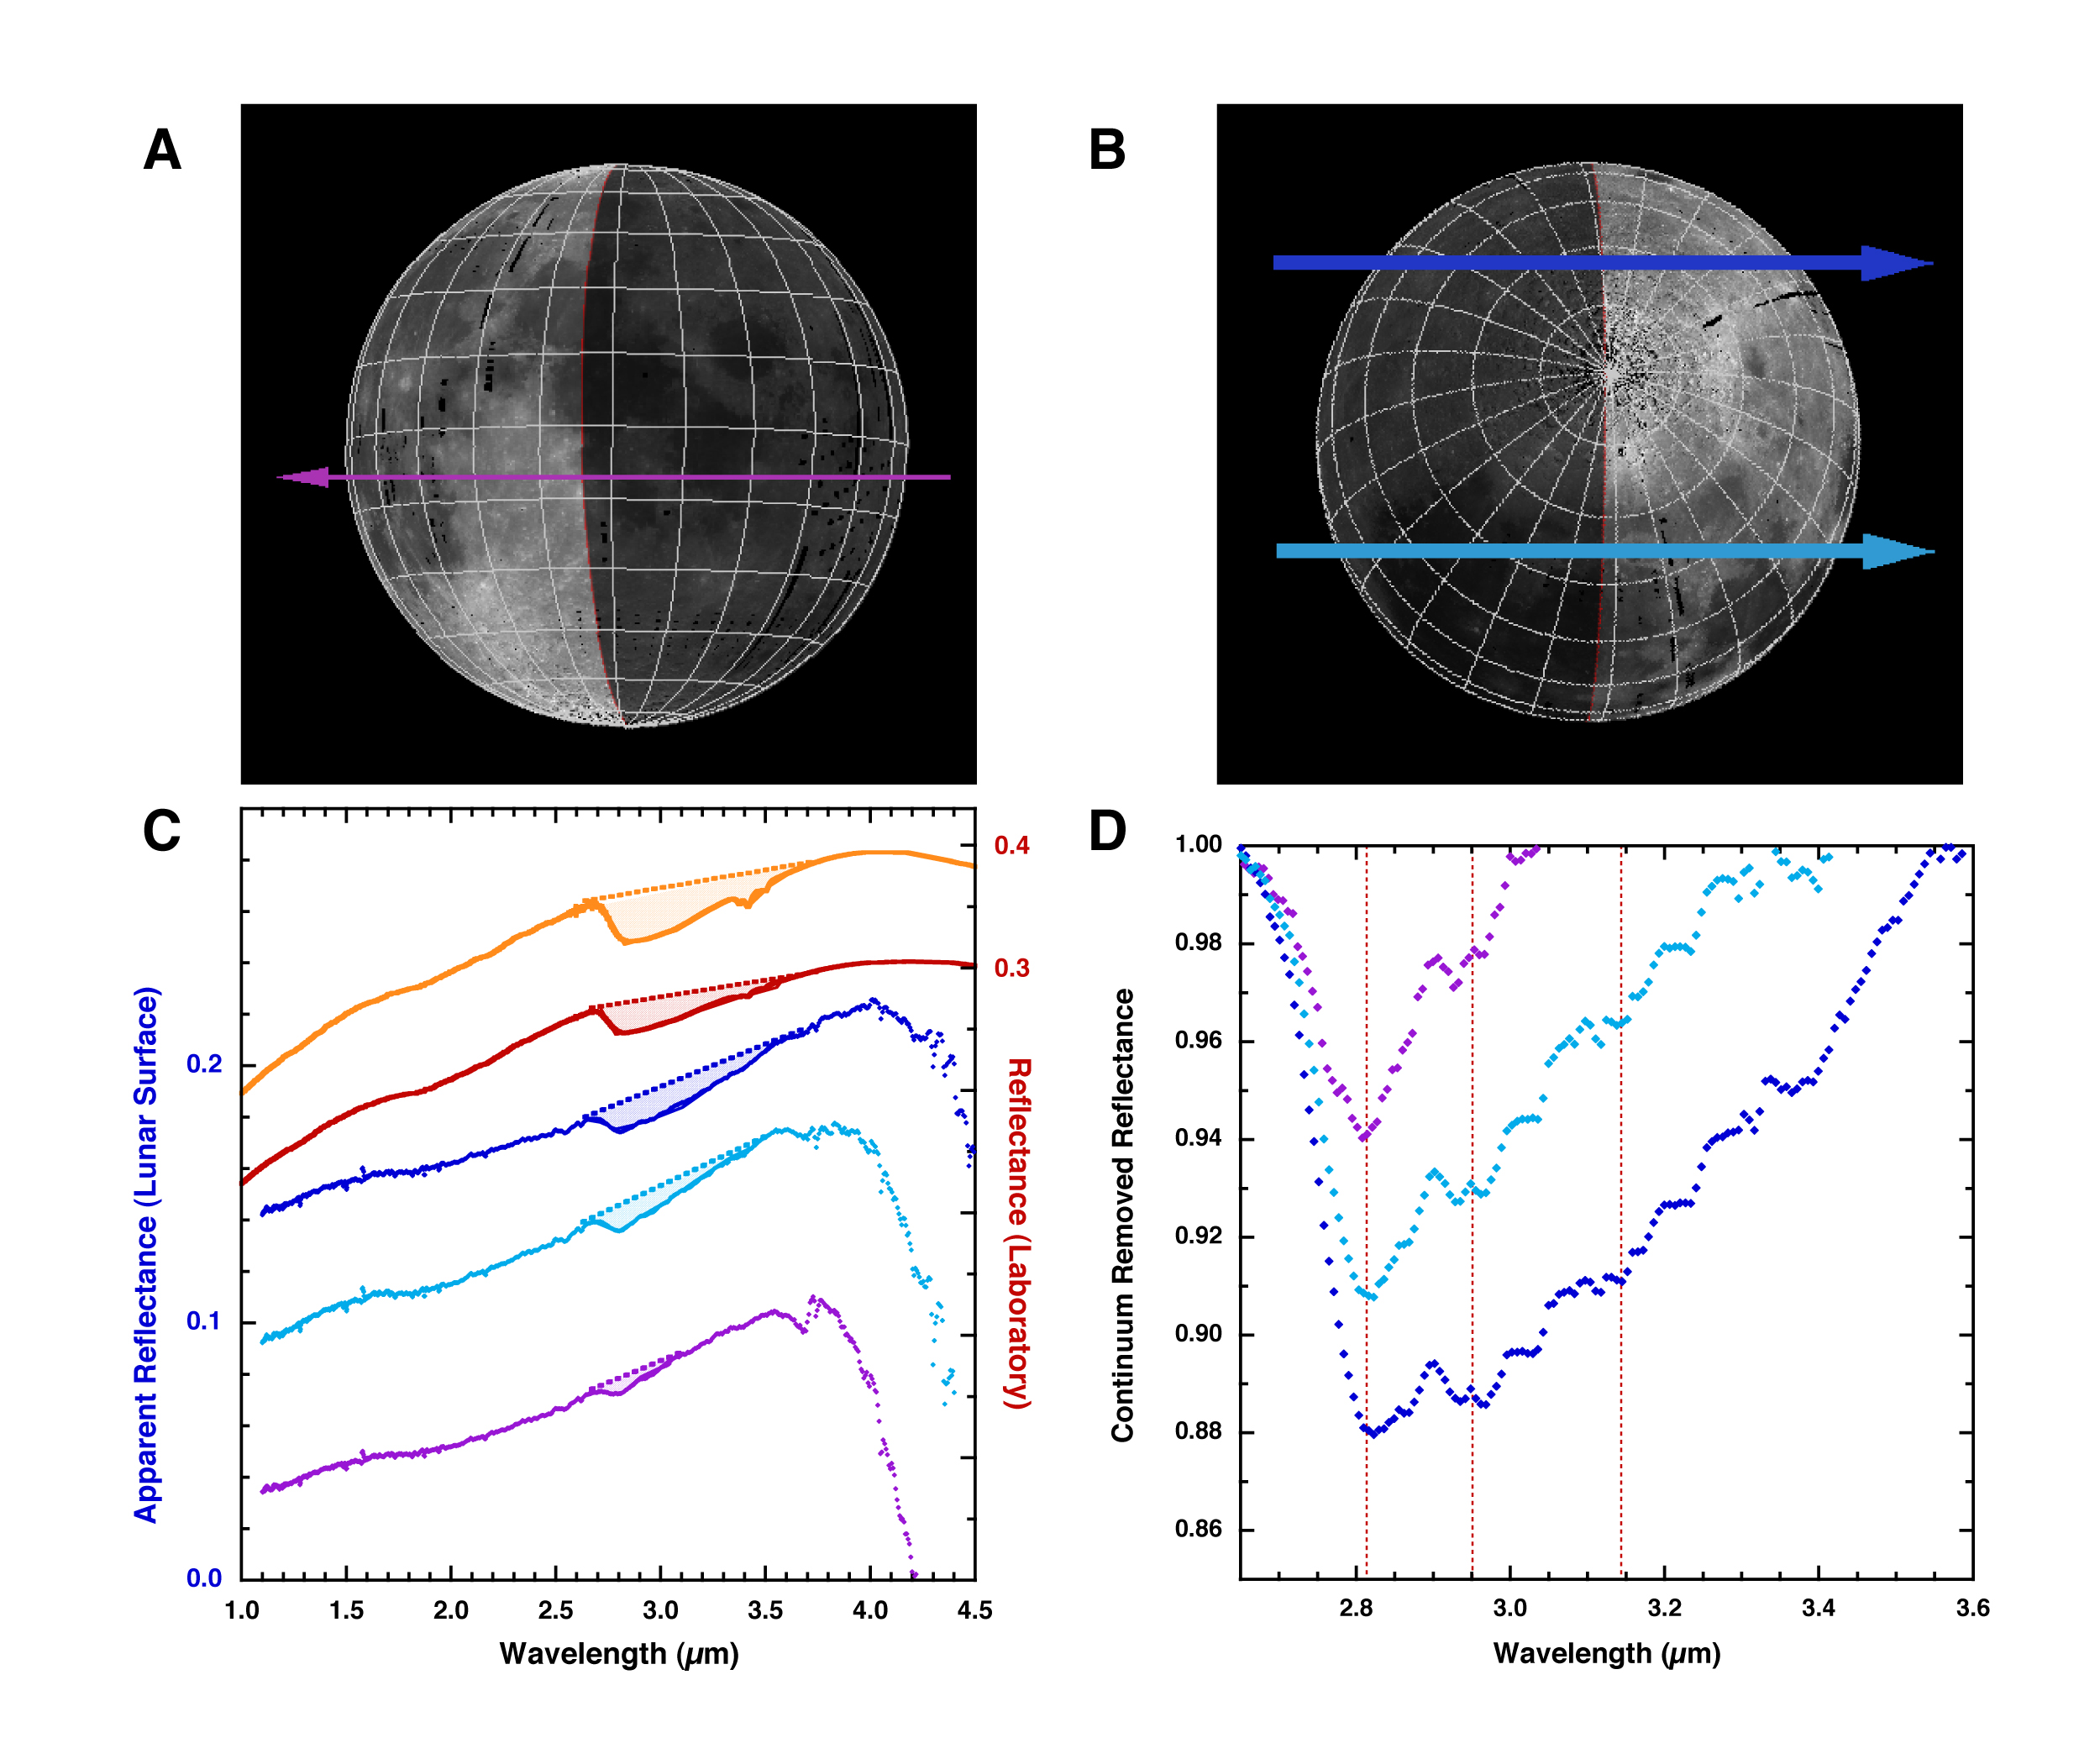
Caption: High signal-to-noise reflectance spectra of the average response along a chord of the Moon acquired as Deep Impact scanned rapidly across the Moon. (A) Location of the equatorial chord (purple arrow) acquired on 29 December, 2007 over a 750 nm Clementine basemap (15° grid). Arrow width indicates size of spectrometer slit. (B) Locations of two chords acquired on 2 June, 2009 at mid-latitudes toward the morning (cyan arrow) and evening (blue arrow) sides. (C) Spectra of the three chords as compared to laboratory data of two lunar soils (14259 red; 62231 orange). Continua over the 3 µm region (dashed) reveal absorptions due to hydration (shaded regions) similar to hydration features in the laboratory data (some, if not all of which is terrestrial in origin). (D) Continuum-removed spectra of the 3 µm regions of the Deep Impact chord spectra. The three major OH and H2O absorptions near 2.8, 2.95, and 3.1 µm are indicated (dotted red lines).
Read More...
Credit: NASA/UMD
Sunshine et al., Science Express 24 September 2009 . Reprinted with permission from AAAS. Permission to reproduce.
Fig 2
 300 dpi jpg
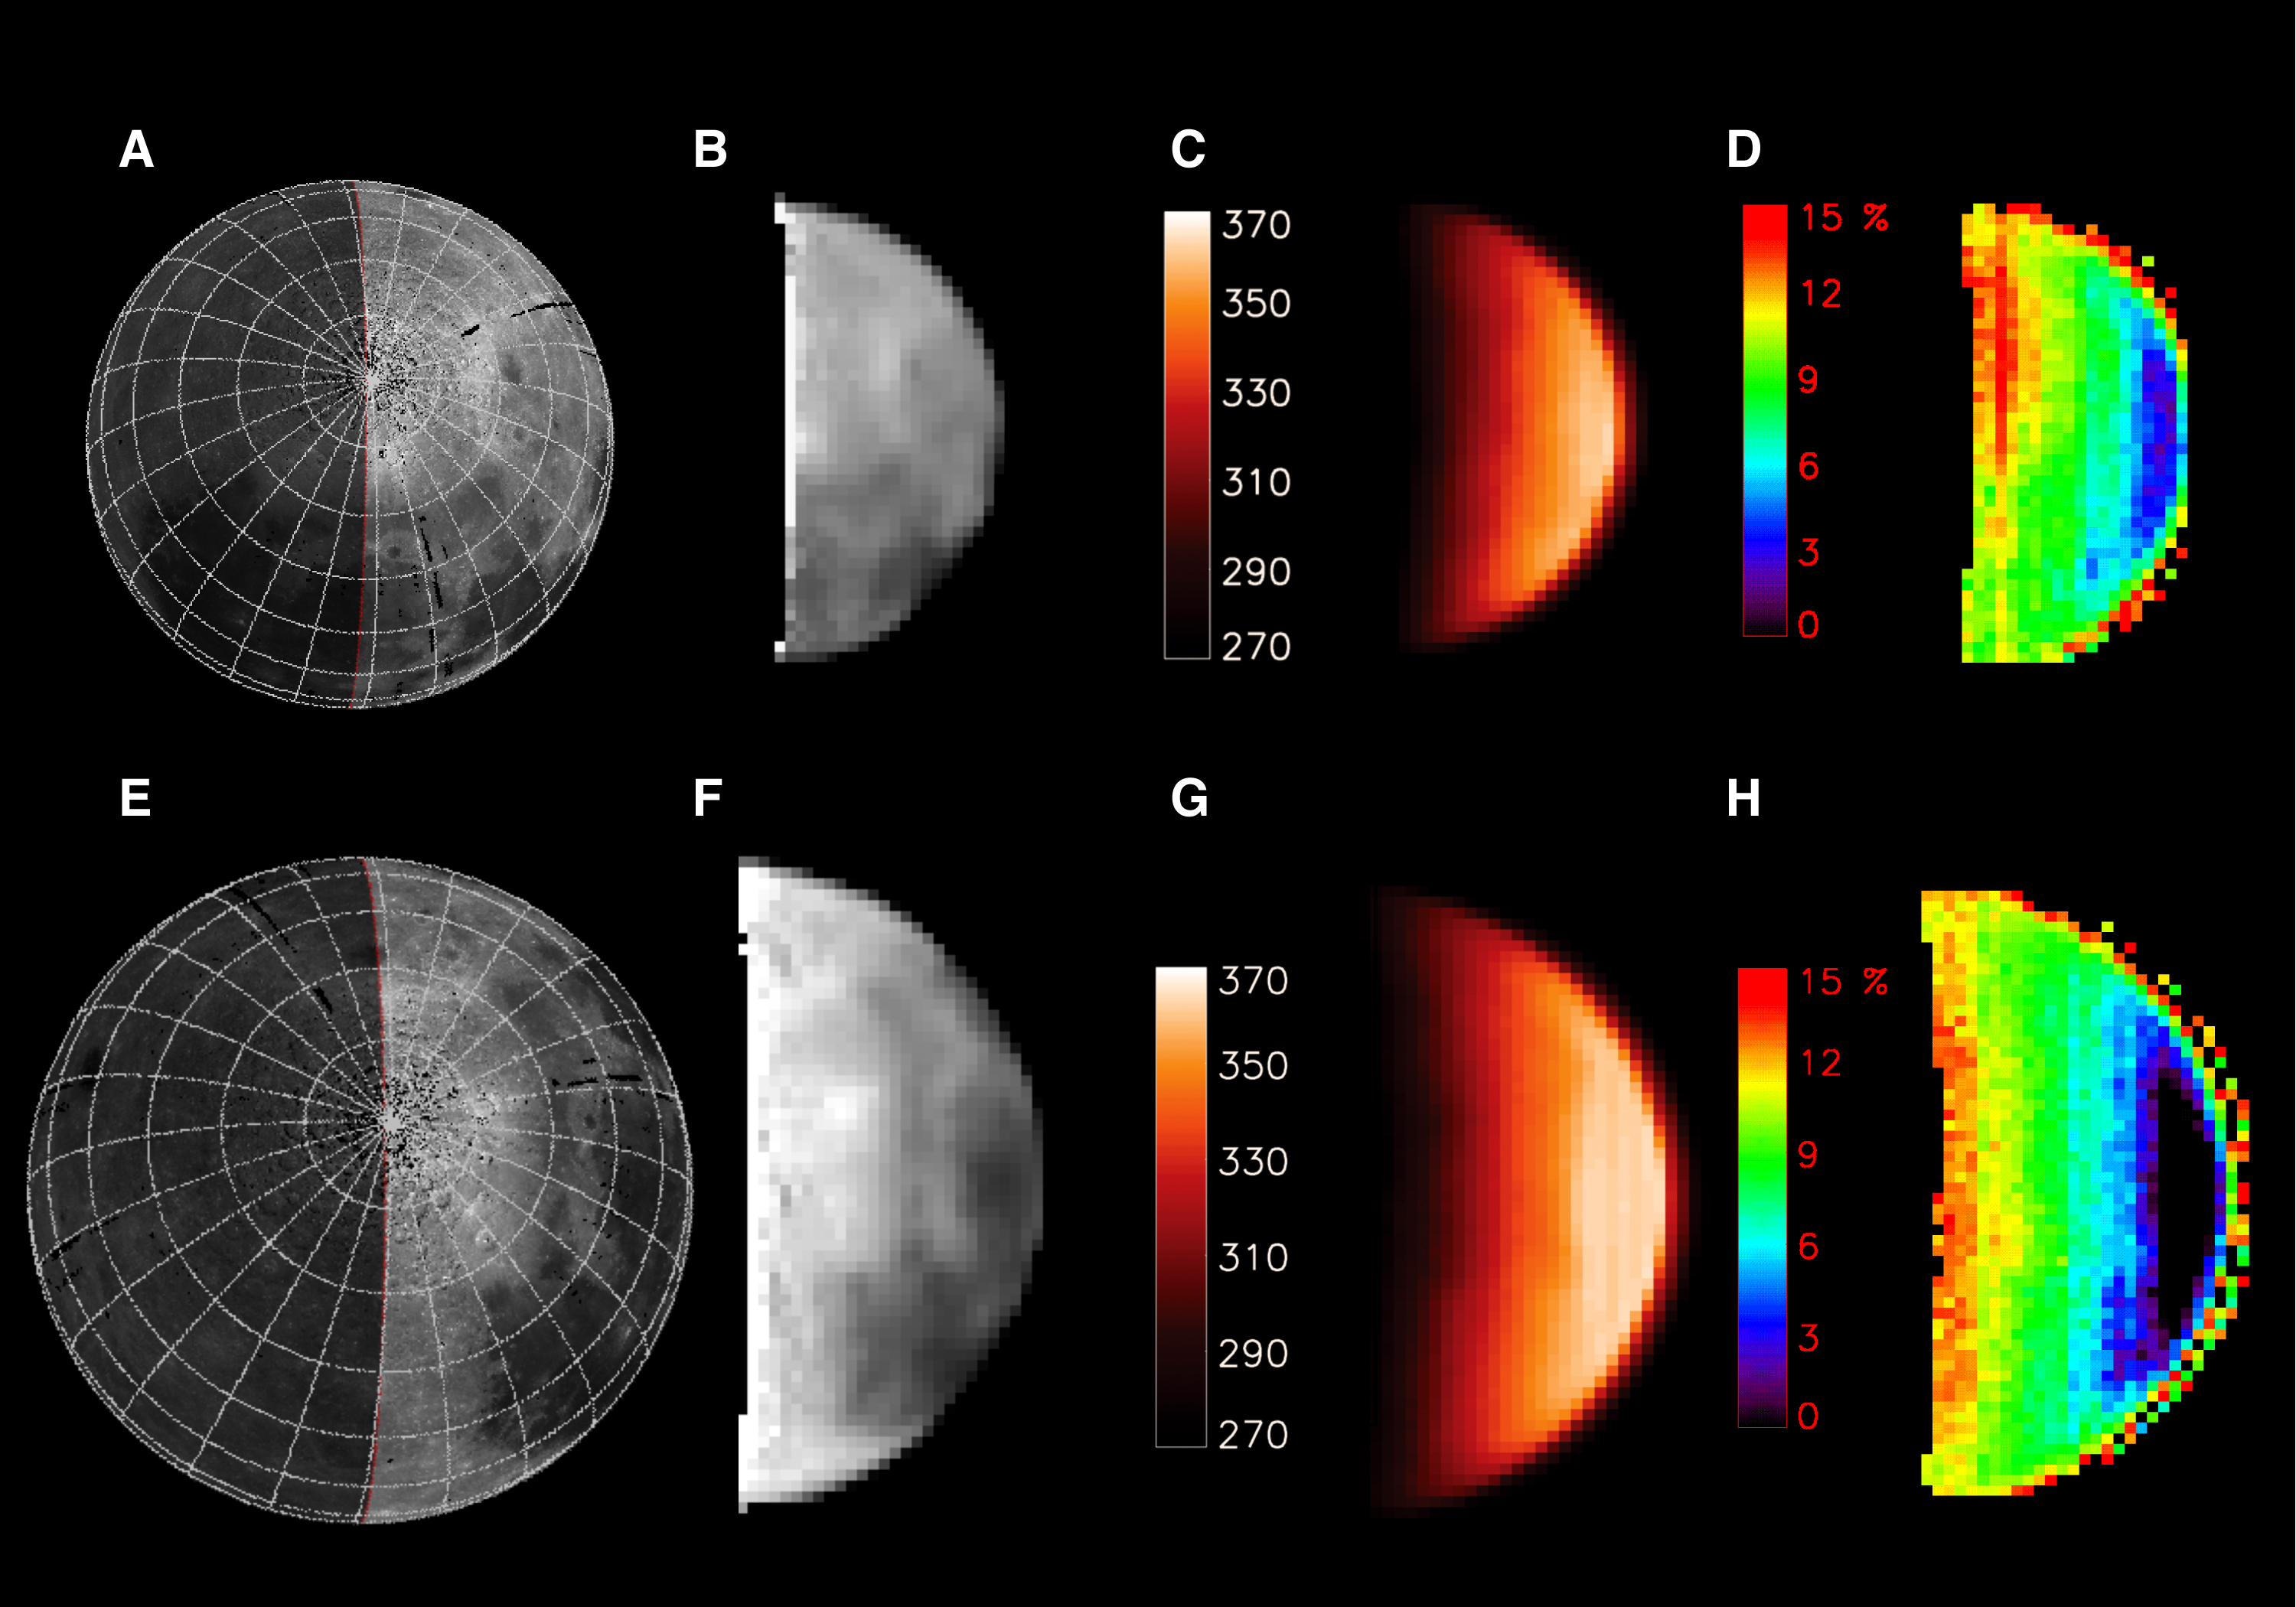
Caption: Two sets of observations over the North pole separated by one quarter of a lunar day. Hydration is detected on both dates at all observable locations (>10°N). (A-D) Data acquired on 2 June 2009 at ~80 km/pixel: (A) Clementine basemap (15° grid) of observed area. (B) 1.2 µm Deep Impact albedo image. (C) Corresponding temperature map derived from >4 µm spectra. (D) Corresponding map of the strength of the continuum-removed 2.8 µm hydration feature. (E-H) Data acquired on 9 June, 2009 at ~60 km/pixel; as in (AD).
Read More...
Credit: NASA/UMD
Sunshine et al., Science Express 24 September 2009 . Reprinted with permission from AAAS. Permission to reproduce.
Fig 2 (crop)
 300 dpi jpg
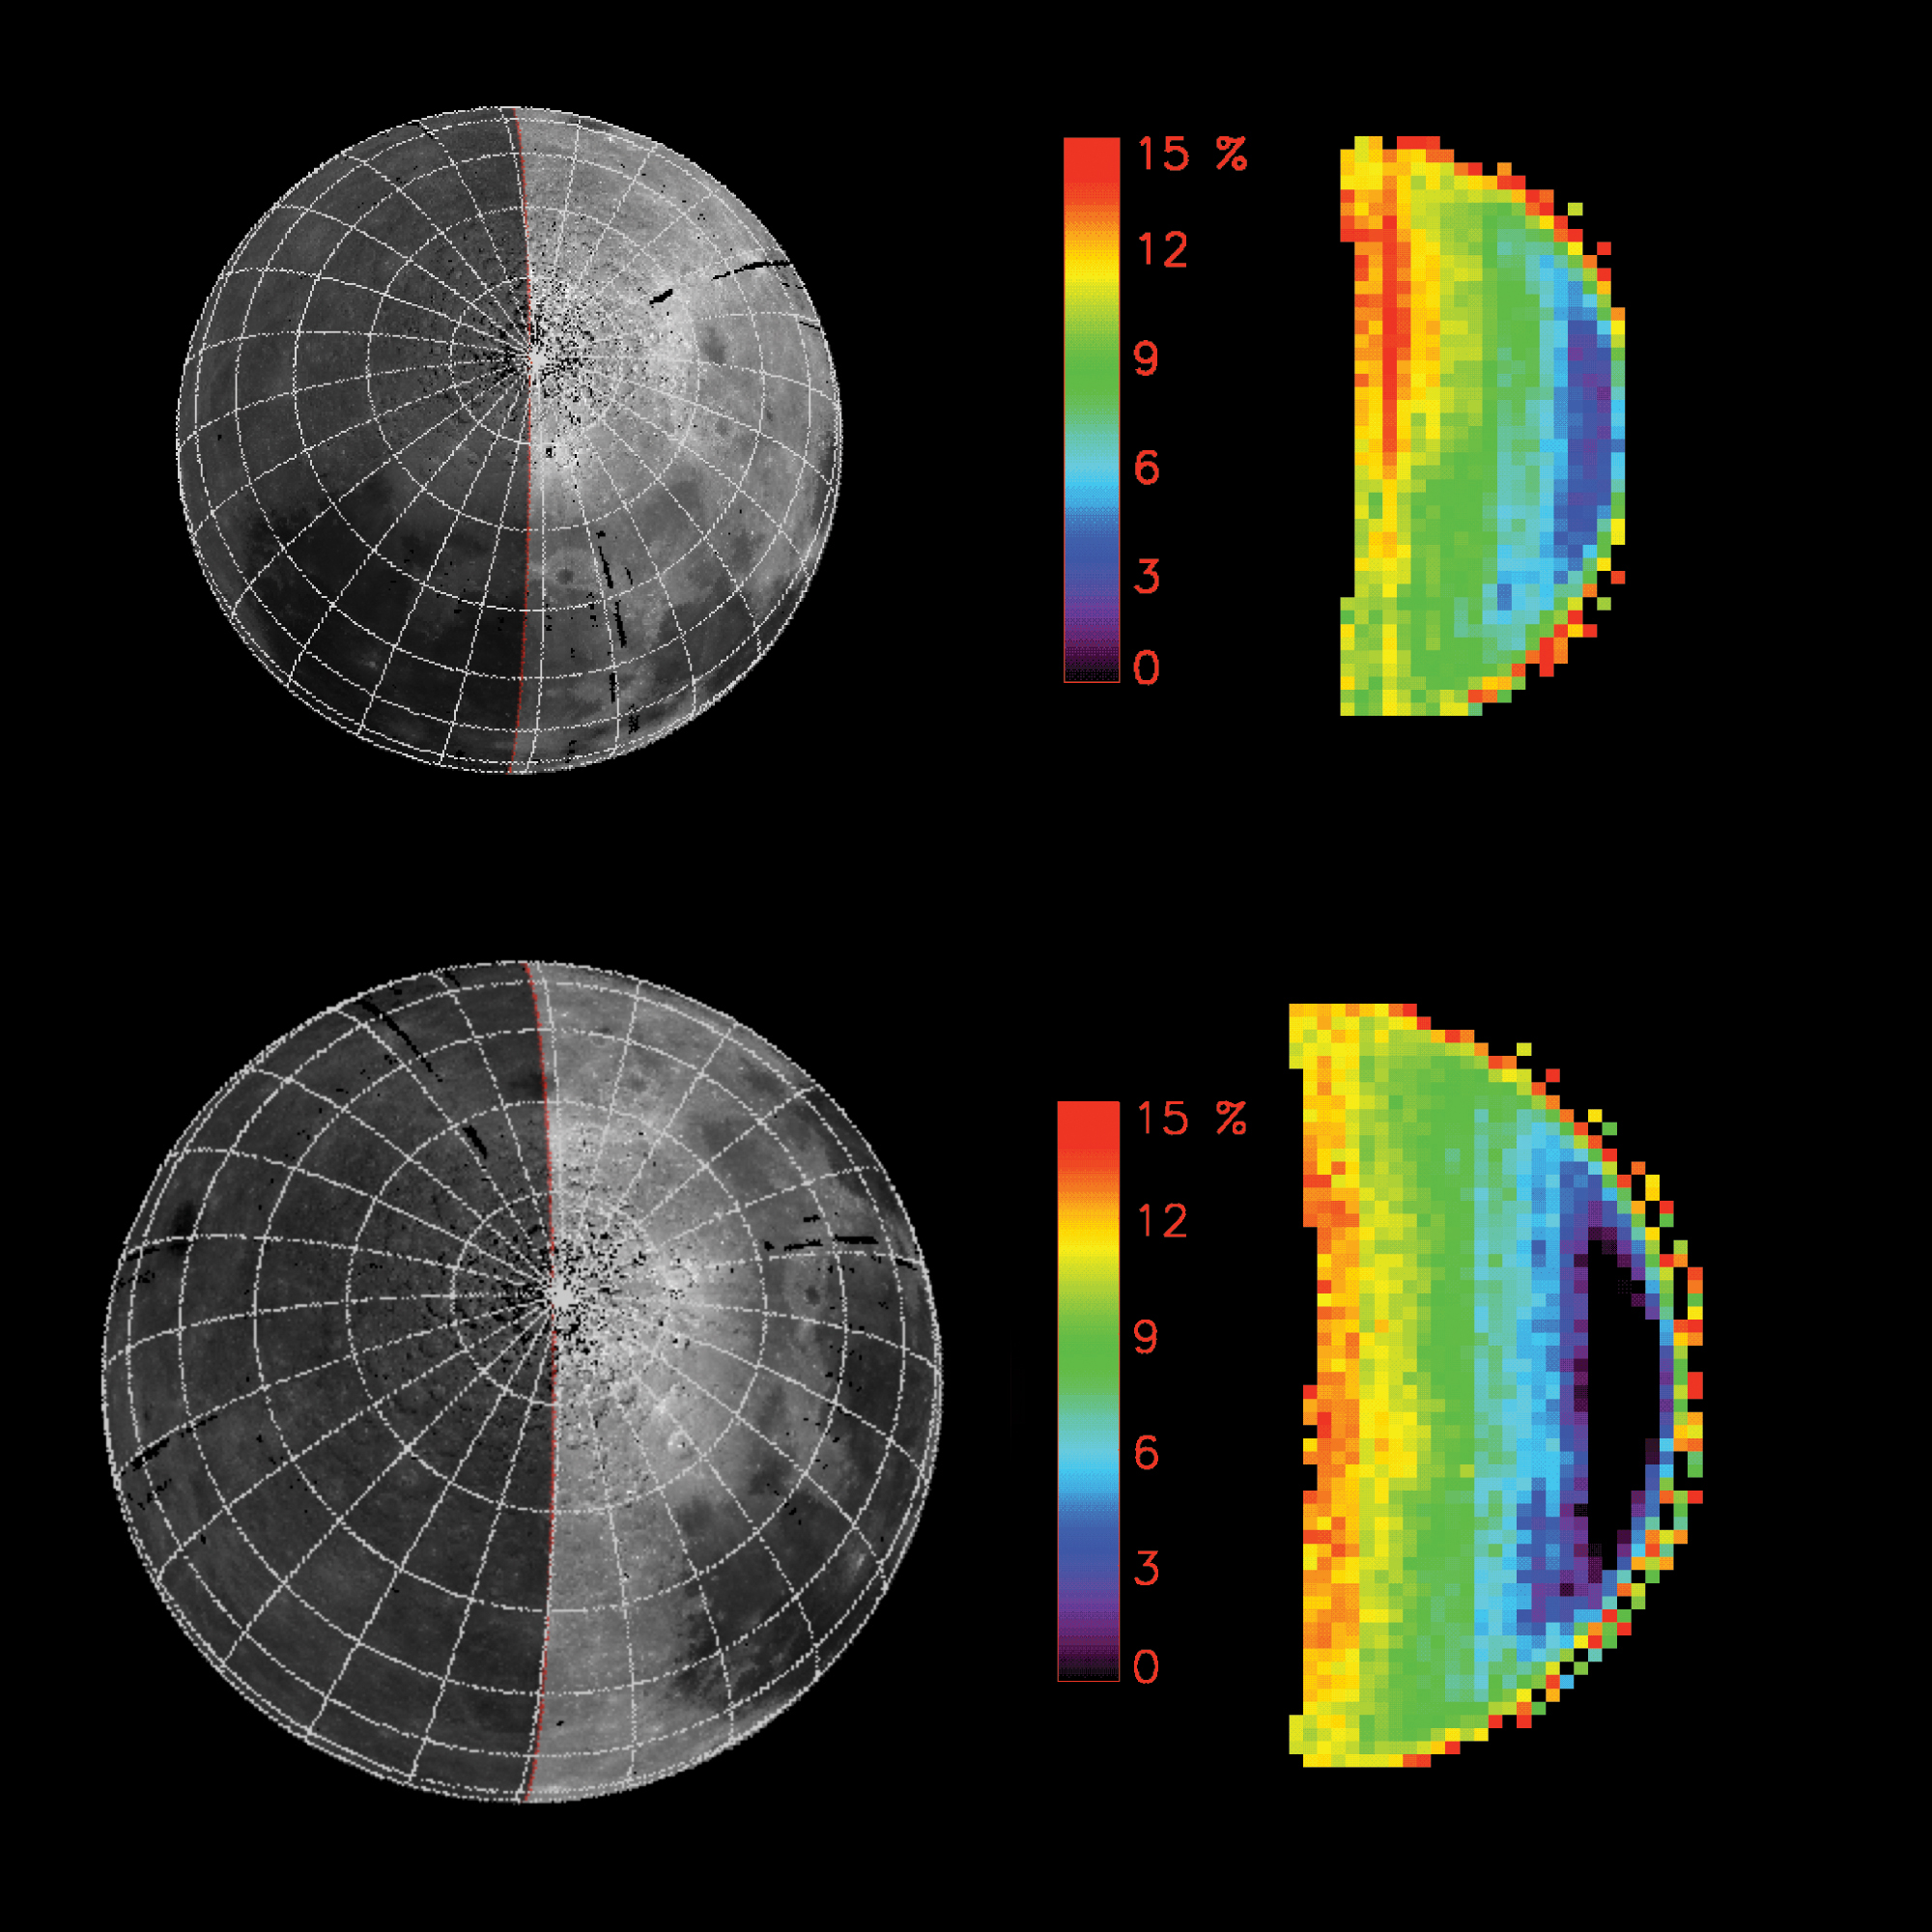
Caption: Two sets of observations over the North pole separated by one quarter of a lunar day. Hydrogen is detected on both dates at all observable locations (>10°N). The temperature maps (right) are derived from >4µm spectra and compared to Clementine basemaps (left) of the observed areas.
top panel: 2 June 2009, ~80km/pixel
bottom panel: 9 June 2009, ~60km/pixel)
Read More...
Credit: NASA/UMD/J Sunshine
Fig 3
 300 dpi jpg
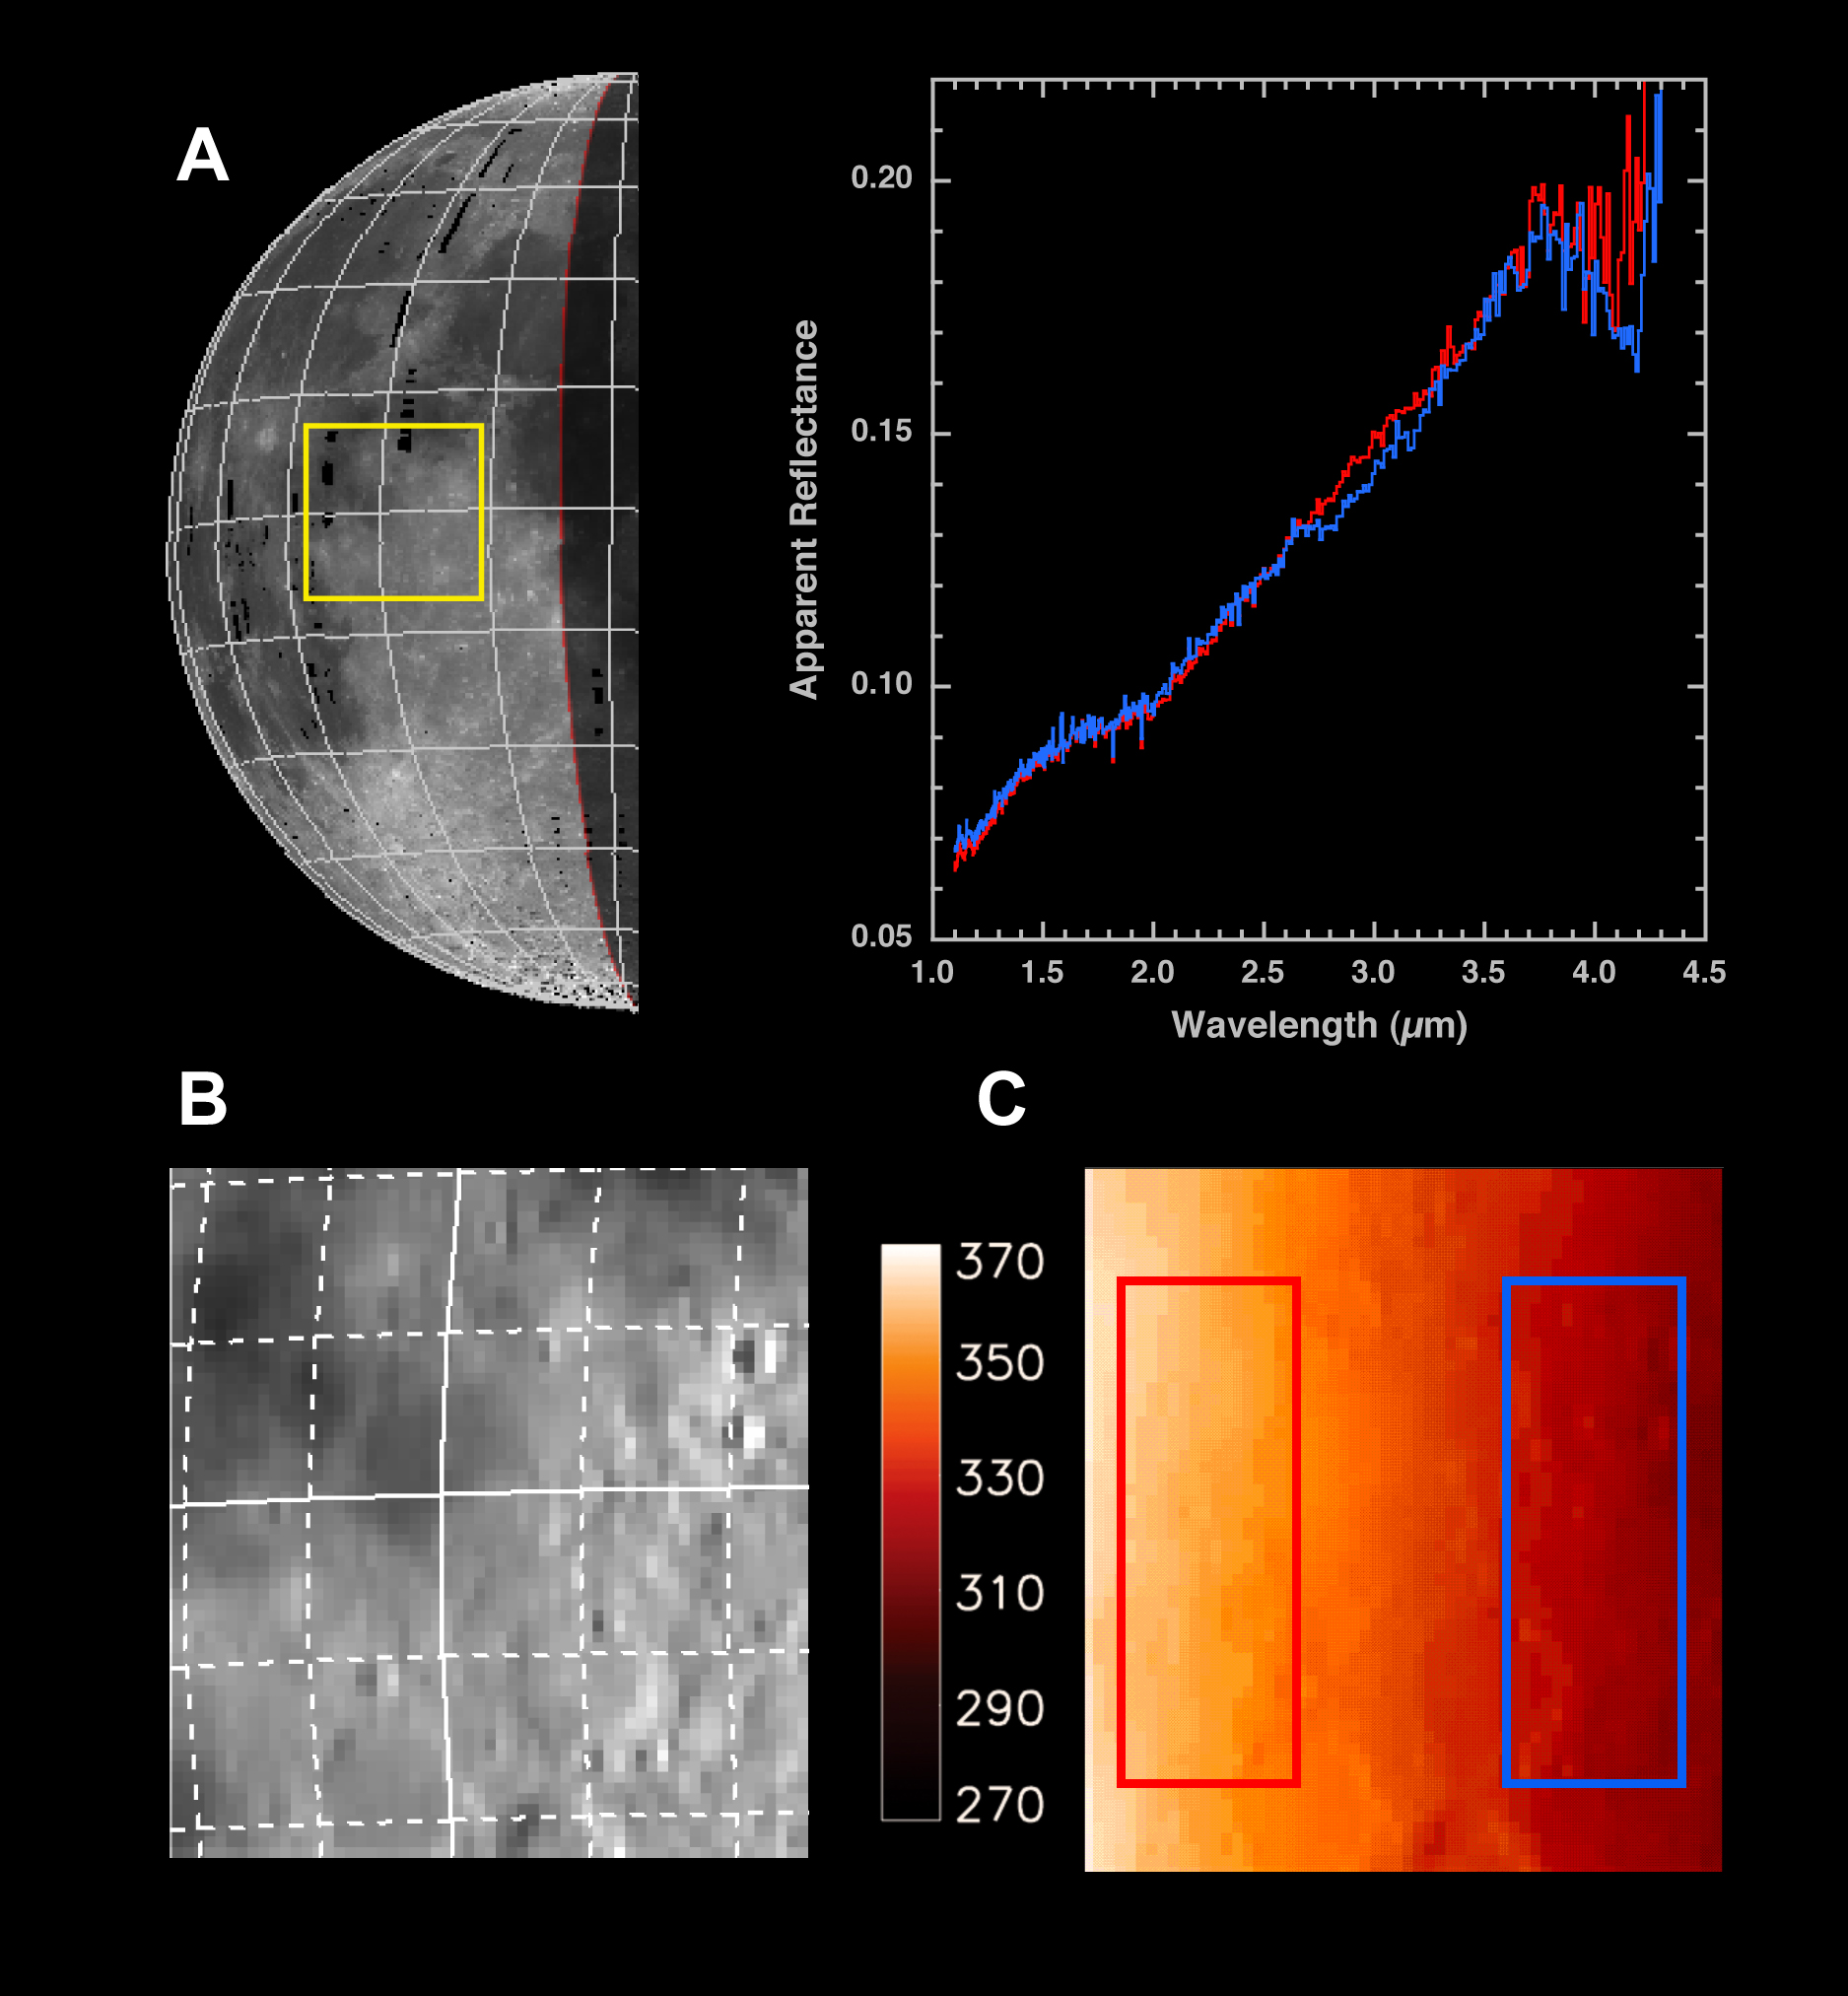
Caption: Equatorial observations acquired on 27 December, 2007 at 10 km/pixel. (A) Clementine basemap (15° grid) of observed area (yellow box). (B) 1.2 µm Deep Impact albedo image (5° grid). Solid lines are the equator and prime meridian, which intersect in Sinus Medii. (C) Corresponding temperature map derived from >4 µm spectra. (D) The average spectrum for the majority of the image lacks a hydration feature (e.g., red). However regions nearer the evening terminator have weak, but distinct 3 µm absorptions (blue). The red spectrum is scaled to match the reflectance of the blue spectrum. See boxes in (C) for locations.
Read More...
Credit: NASA/UMD
Sunshine et al., Science Express 24 September 2009 . Reprinted with permission from AAAS. Permission to reproduce.
Fig 4
 300 dpi jpg
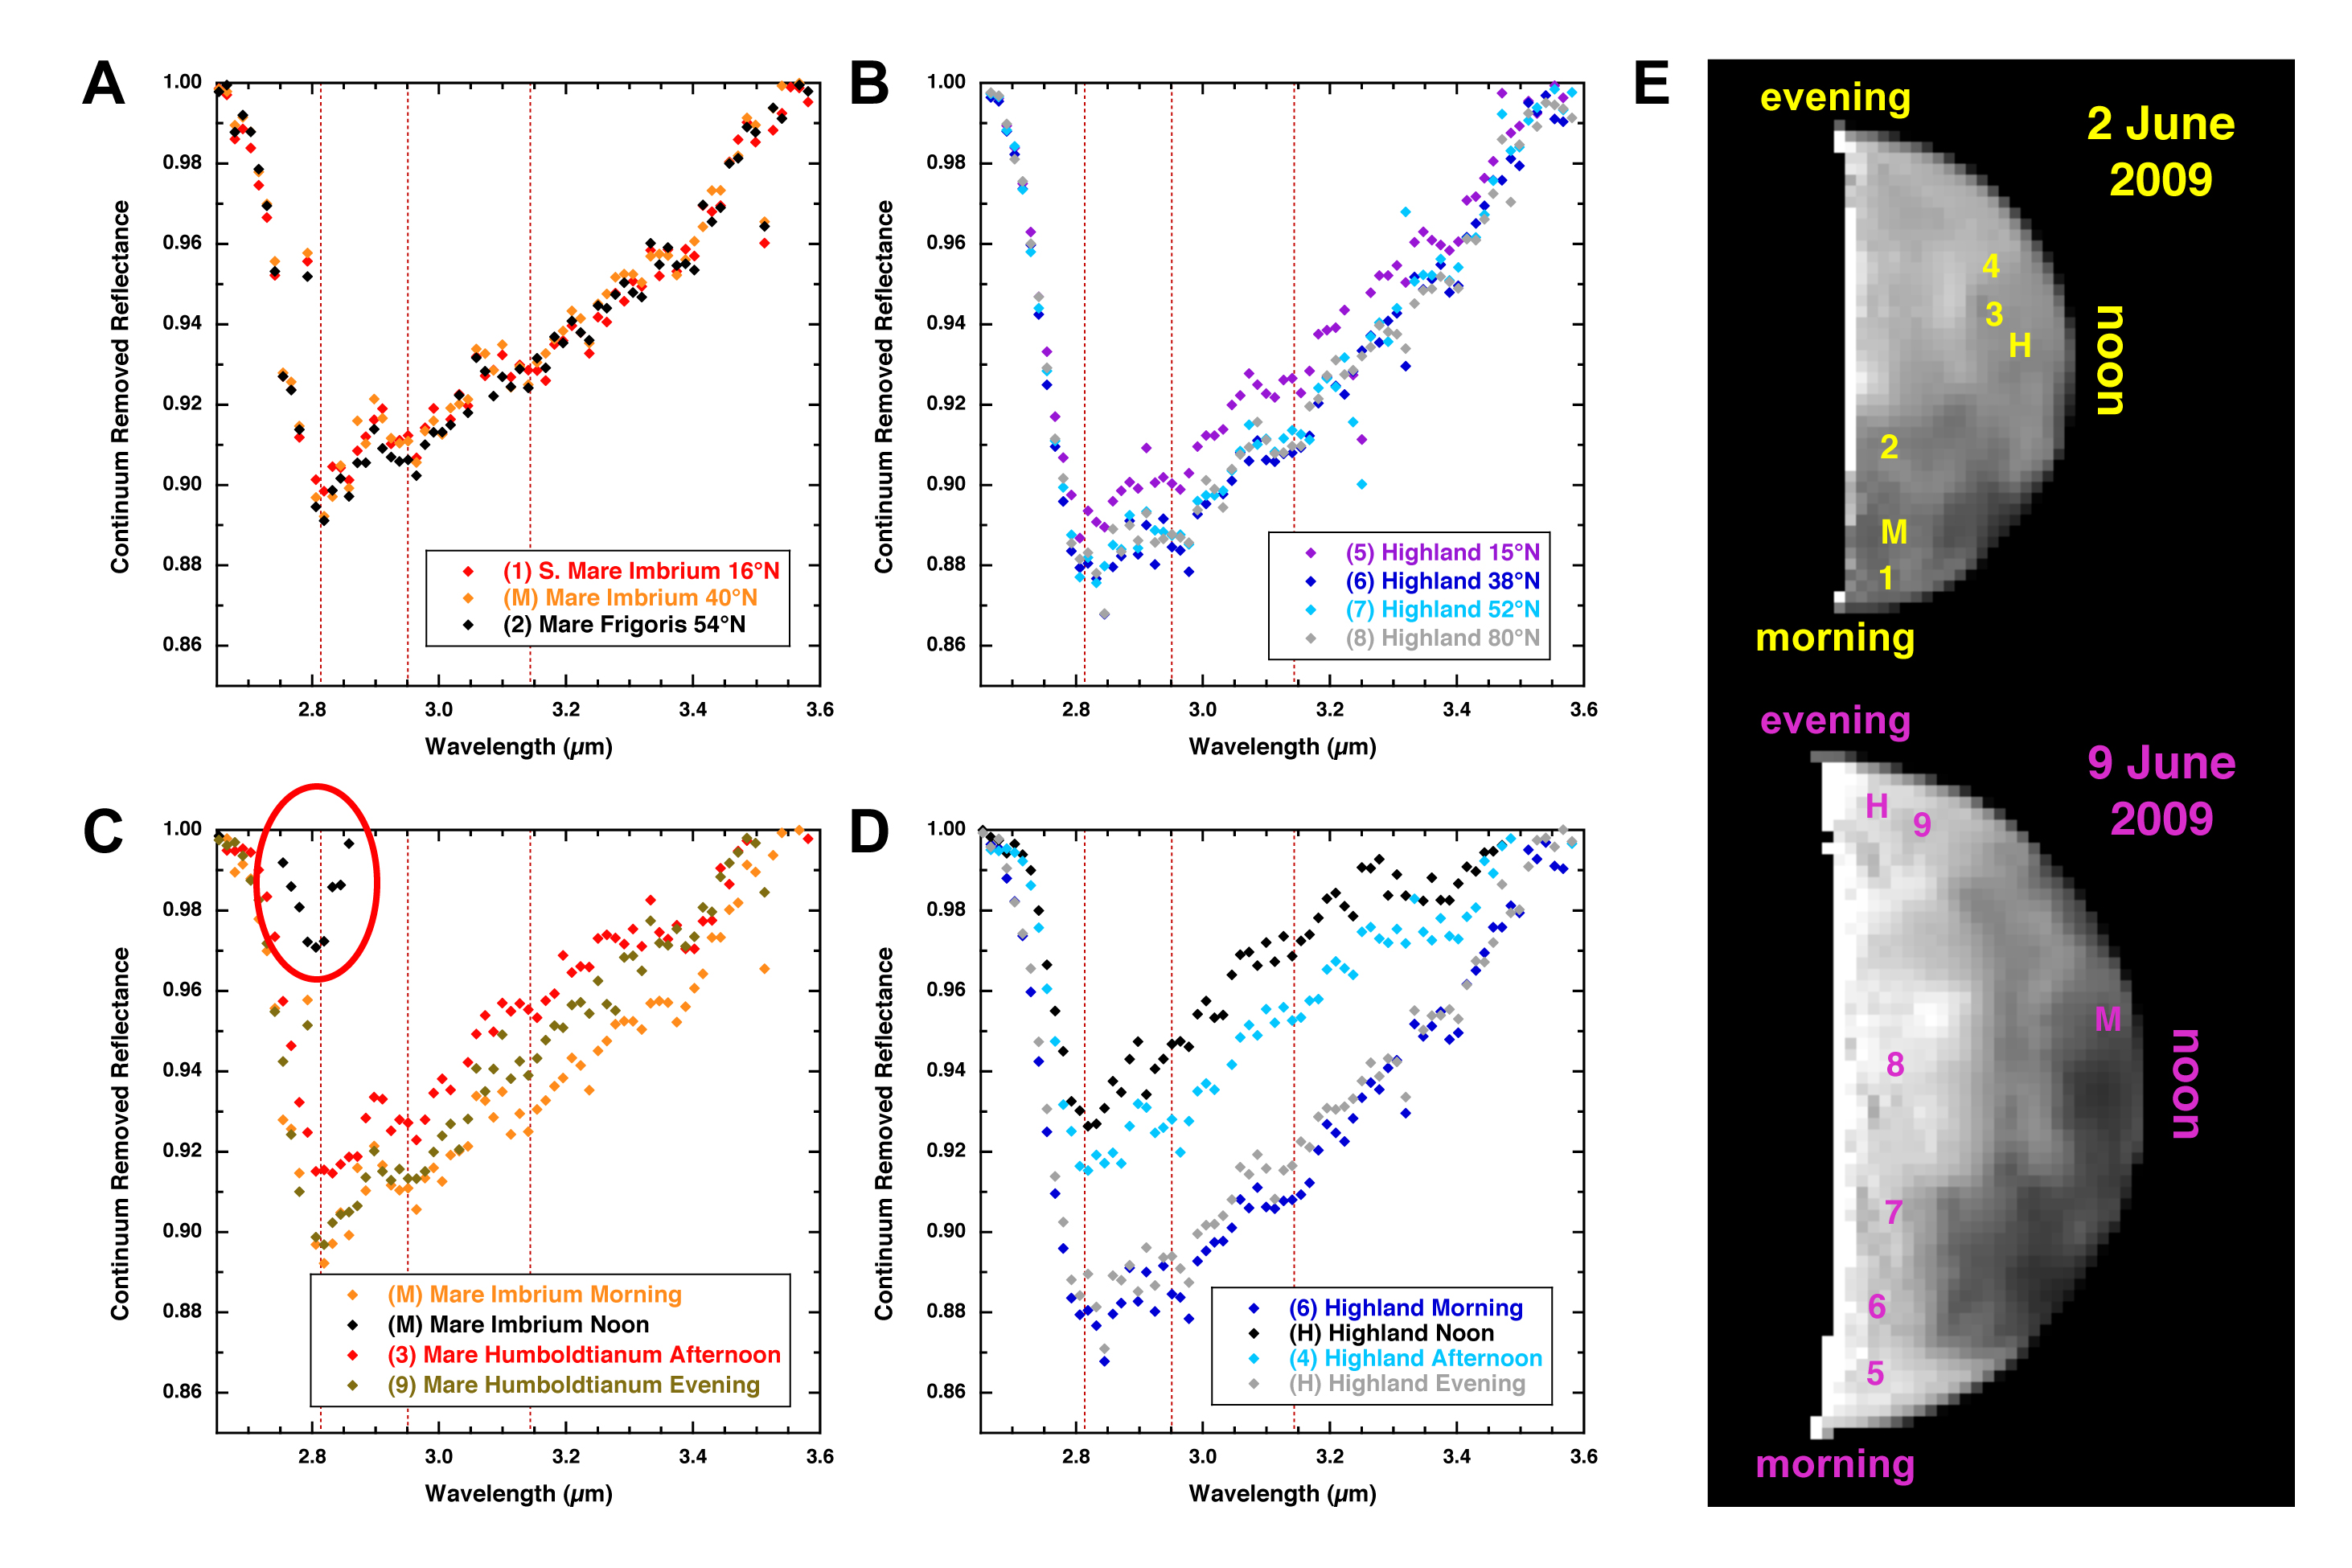
Caption: Comparisons of mare and highland terrains as a function of latitude and time of day as observed over a quarter of a lunar day (90° rotation) from 2 and 9 June, 2009. (A) Maria ranging from 16-54°N along the morning terminator on 2 June have the same continuum-removed band depth and overall shape. Locations as indicated on (E). (B) Same as (A) for highland units ranging from 15-80°N on 9 June. (C) The same location in eastern Mare Imbrium ('M') that is observed in the morning (orange) on 2 June rotates to noon (black; red circle) on 9 June with a 70% decrease in continuum-removed band depth and a distinct change in shape. (D) The highland unit south of Mare Humboldtianum ('H') was observed at noon (black) on 2 June and in the evening (gray) on 9 June with only a 50% change in band depth. By evening both mare (brown) and highland (gray) terrains return to their morning abundances (orange and blue, respectively). (E) Locations for terrains whose spectra are plotted on Figs. 4, A-D on 2 June (top) and 9 June (bottom). The mare and highland units marked with 'M' and 'H' are visible in both datasets. All spectra are averages of 3 by 3 pixel areas.
Read More...
Credit: NASA/UMD
Sunshine et al., Science Express 24 September 2009 . Reprinted with permission from AAAS. Permission to reproduce.
- EPOXI EPO Lead: Dr. Lori Feaga
- Webmaster: Elizabeth Warner
- Last Updated: Fri 02/23/18
- Web Accessibility
- + Contact NASA